Cup and Handle Pattern: Meaning, Formation and Uses


Every candlestick chart represents a movement in the price of a security. These include rectangle, hammer, triangle, cup and handle. Each stage of the formation and completion of these patterns represents a buying or selling opportunity.
These charts exhibit an entry point, a target price to close out a profitable trade, and a stop loss point for risk management purposes. A cup and handle pattern represents a continuation of bullish sentiments in the market. Let’s see the different aspects associated with this pattern, like its formation and usage.
What Is the Cup and Handle Pattern?
William O’Neil introduced the world to this pattern in 1988. He had discussed it in his book named “How to Make Money in Stocks”. As the name suggests, this pattern takes the shape of a cup and its handle.
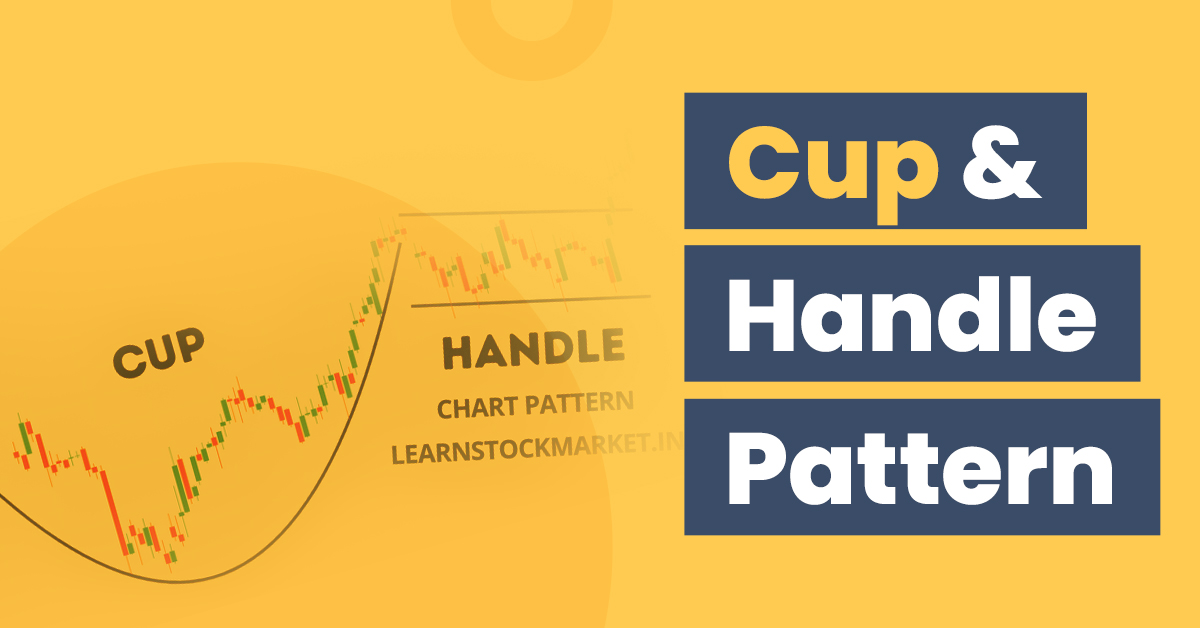
This pattern is a bullish continuation depicting a period of consolidation after a breakout. It has two parts – a cup and a handle. The formation of a cup occurs after a forward movement, and it is viewed as a bowl with a round bottom. After the completion of the cup pattern, the second part, i.e., the handle, gets formed.
You can see the formation of a handle on the right side of the cup. There is a breakout from concerned trading range, signalling continuation of the prevailing uptrend. Cup and handle pattern is indicative of bullish signals or an uptrend. Moreover, when you are looking at the right side, you can see that trade volume decreases in that corner.
Now that you are aware of the meaning of cup and handle pattern let’s shift our focus to its formation.
What Does the Cup and Handle Candlestick Pattern Tell You?
The asset that forms this pattern challenges its previous highs. In doing so, it incurs severe selling pressure from traders who had bought at that particular level. This heavy selling pressure leads to price consolidation for a small period of time.
Following the consolidation, the asset heads for a downward trend. This may continue for up to four weeks, and after this, the price would start moving upwards due to buying pressure. This signals a bullish continuation, and you can consider these signals as a buying opportunity.
You can look out for the following while identifying cup and handle patterns:
- Depth
Generally, the cups are not very deep in these patterns. You should try to avoid considering handles that appear very deep, as they are expected to form in the top half.
- Volume
Volume is directly proportional to prices in this pattern. As the price of the asset falls, volume of trading will also fall. The volume shall be lower than average at the cup’s base. After this, volume shall increase as price also starts moving up on the way back to old high points.
- Length
Cups having a longer and broader “U” shaped base indicates strong buying signals. It will provide more concrete evidence of an impending rise in the asset’s price. You should try to avoid cups having a sharp “V” shaped base as it may provide ambiguous signals.
It should be noted that the more the top of the handle is apart from high price points, the more the pattern will exhibit a prominent breakout.
How Does the Cup and Handle Pattern Work?
The cup will have a round shape resembling a big bowl. In an ideal setting, on either side of the cup, the height should be equal, but this does not usually happen. The high portion on the right side witnesses a fall, which creates a handle in this pattern.
The handle is nothing but a consolidation before the breakout. Time period for formation of the cup usually ranges between 1 to 6 months, and in some cases, it could be a bit more. At the same time, handles may get formed between 7 to 28 days.
This pattern also represents a buying opportunity after the asset moves past the previous resistance point, which is near the right side of the bowl. The breakout leads to increased trading volume as well. One way of obtaining price targets is by measuring the distance from base of the cup to top right corner and adding this to the buy price point.
Also Read: What is Price to Earnings Ratio – PE Ratio in Stock Market
How to Trade Using Cup and Handle Candlestick?
There are three important points related to trading a cup and handle pattern:
- Select entry point
The first thing about trading is selecting an entry option. Handles are usually triangular in shape or have lateral descending channels. The best time to buy and make an entry is when the price crosses the top of these channels. This is because when the price crosses the handle, pattern formation gets complete, and the price of the underlying asset will rise.
Even though the price is rising, there is no guarantee that it will continue doing so. It may fall or remain flat after a short rise. Therefore, for risk management purposes, it is essential to have a stop-loss target.
- Stop loss
This is a mechanism that reduces your potential losses if the asset starts to fall instead of rising after the breakout. It mitigates the risk associated with trading by squaring off a position if the price falls substantially to neutralise the candlestick pattern.
You can put your stop loss below the bottom point of the respective handle pattern. However, in case price is showing vulnerability and has moved up and down in recent times, you can place the stop-loss target below the lowest point of the most recent swing.
In an ideal scenario, stop-loss targets will be in the upper 1/3 of the cup pattern. This is helpful as the setting of both the stop loss targets and handle in the upper 1/3 segment means that the stop loss target will be near to the entry point.
- Profitable exit
You can use a simple formula for identifying the most appropriate exit target irrespective of the cup’s height. This involves summing up the height of the cup with a breakout point. In some cases, the left and right-hand sides of the cup show different heights.
In such a scenario, you can add a lower height point for selecting a conservative and pragmatic target. You can also add a longer height with a breakout point for selecting optimistic or aggressive targets.
Also Read: What Is Swing Trading?
Final Word
The cup and handle pattern is a popular candlestick pattern that exhibits continuation of bullish trends after a consolidation phase. It is an ideal signal for buyers who are waiting to enter the trade. However, like other candlestick patterns, this may also give misleading signals in some cases. It is imperative that you refer to other indicators as well before taking any investment or trading decision.
Frequently Asked Questions
What happens after the formation of the cup and handle pattern?
After the formation of this pattern is complete, the concerned security or asset will see a steep rise in its price over a short to medium term. However, if prices do not increase, it may indicate a false signal or a failure of the pattern.
What are the limitations of the cup and handle pattern?
One of the biggest drawbacks of this pattern is that it may take a lot of time to form. A time horizon of several months may lead to delays in action and decision-making.
Is cup and handle candlestick bullish?
Yes, this pattern is a signal of bullish market sentiments, which means that prices will move upward upon completion of this pattern. You can also consider this as an indicator for going long.
What is the percentage of correction in the cup and handle pattern?
According to William O’Neil, who introduced the world to this concept, the percentage of correction in the cup and handle pattern from its peak to its lowest point ranges from 12% to 33%.


