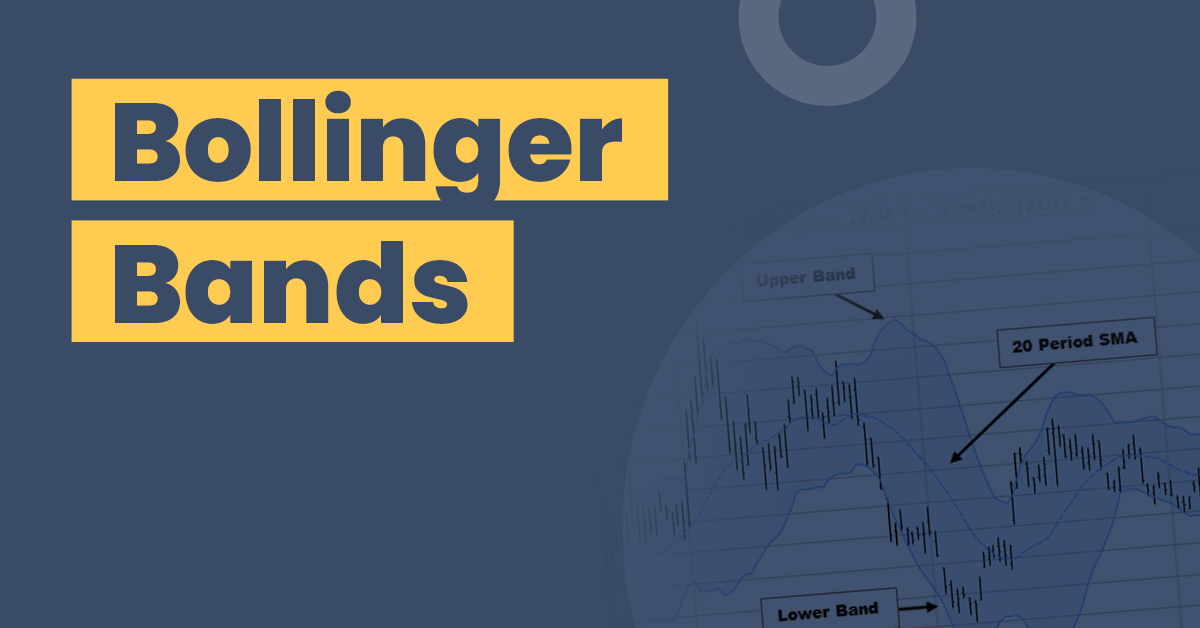
Bollinger Bands: Meaning, Importance & Usability


Trading in stock markets can be quite challenging for market participants due to high volatility and fluctuations associated with the same. To make trading a bit easier, traders take the help of a number of technical indicators.
Bollinger bands are one such technical trading indicator that market participants use to have a better understanding of stock trading and consequently make wiser decisions. In this article, we will discuss some more intriguing concepts about this particular concept.
What Are Bollinger Bands?
It is a trademark indicator developed by John Bollinger. He was an eminent technical trader who efficiently used this indicator to get an idea regarding prevailing market sentiments and determine whether a stock is overbought or oversold.
This indicator functions as a price envelope. Price envelopes are those that determine lower and upper price ranges. It is plotted at the Standard Deviation (SD) level higher and lower than a simple moving average of the respective price level. The standard deviation is a measure of variation from the mean (such as spread, dispersion).
The standard deviation level determines the distance between these bands and subsequently changes as per the volatility of the price. Now that you are well aware of the meaning of Bollinger bands, let’s move our attention toward the other aspects of this technical indicator.
How Do Bollinger Bands Work?
This technical trading indicator is an important indicator for measuring volatility in a security or the overall markets. A tightening of these bands during phases of low volatility means that there is an inevitable and sharp price movement in either direction. It signifies the start of a trend.
However, when such a band gets separated by significantly larger amounts, the prevailing volatility rises, and the trend is moving towards the end. The security price tends to move between the higher and lower price ranges. It touches one range and then generally starts to move in the other direction.
Traders take the help of these swings to recognize the profit target level. Suppose a price level touches the upper price band and then moves below the simple moving average line, the lower band becomes their stop loss position. It means that you can exit the trade once the price reaches the lower band.
How to Use Bollinger Bands?
Initially, traders compute the Simple Moving Average (SMA) of a particular timespan for say 30 days. The computed simple moving average is then plotted on a line graph. After this, the next step is to plot the standard deviation points against the same to exhibit various price fluctuations.
We have already discussed the conceptual basis of standard deviation. But the theoretical meaning should be backed with a practical formula. The formula for computing standard deviation is below:
σ = √Σ(X-µ)/n
Σ represents summation
X is a sample taken from the population
µ is the population mean
n represents the number of samples
In the case of Bollinger bands, traders compute the upper and lower price ranges by multiplying respective standard deviations by two. After this, they shall add and subtract the number from the respective values to ascertain upper and lower price ranges and plot them accordingly.
You can determine the upper and lower Bollinger bands by using the following formula:
Bollinger Upper band = SMA (TP, n) + m* σ (TP, n)
Bollinger Band Lower band = SMA (TP, n) – m* σ (TP, n)
Whereby,
SMA is simple moving average;
TP is typical price = (High price + Low price + Close price)/3;
n = number of days for which moving average has been computed;
m = number of standard deviations (generally this variable is taken 2);
The main usage of Bollinger band is to predict changes occurring in different market sentiments.
How to Calculate the Value of Bollinger Bands?
Here are some steps that you need to follow to calculate Bollinger bands:
Step 1: The simple moving average of the corresponding closing price represents the middle trend line of this band. It is very simple to calculate the moving average variable. You can collect and sum up the closing prices of the respective timespan, say for 10 days, and divide this summation by 10.
Step 2: Calculate the standard deviation value of the taken data set.
Step 3: After this, you need to compute the upper Bollinger band, which is also the upper trend line. For this, just add the moving average price with twice of standard deviation value.
Step 3: The last step entails computing the lower Bollinger band by subtracting twice the standard deviation value from the moving average price of the particular security.
Also, there are multiple tools available online to calculate Bollinger band
Final Word
Bollinger bands are an effective technical trading indicator that determines the sentiment prevailing in the overall market or a particular stock. It is important to note that if you are planning to use this indicator, you should also keep an eye on other variables, as relying only on one may give false signals and wrong trading decisions.
Frequently Asked Questions
What is intraday trading?
Intraday trading is a type of trading. In an intraday trade, you buy and sell an asset on the same day. You do not hold the asset for a longer period. Intraday trading can be done for stocks, commodities, derivatives, etc.
What is the limitation of Bollinger bands?
As this band uses the simple moving average price levels, weightage is more on the old datasets rather than newer ones. Therefore, it may give out false or misleading signals in some cases.
What are the different components of Bollinger bands?
Different components of these bands are simple moving averages, number of SDs, upper and lower price ranges, and days for which analysis of data takes place.
What is squeeze in Bollinger bands?
The upper and lower price range come close to each other when volatility reduces. This compression of upper and lower bands is known as a squeeze.


